The Assets page lets you get detailed information about hardware assets in your system, including:
- Endpoints
- Gateways
- Meters
- Registers
- Sensors
- Valves
NOTE: If you do note see one or more of the above entries in the drop-down menu, it is because there are no matching assets in your asset inventory.
By default, All Assets are displayed in a List View.

Use the drop-down menu above the left side of the table to select an asset type.

Type an asset property (serial number, status, etc.) in the Search box and click >b>Search to quickly locate items of interest.

TIP: Use the All Asset drop-down menu to select an asset type before performing a search. This returns results for the specified asset type.
Click Export in the lower left portion of the screen to download the currently displayed table as a CSV-format file or to see a list of recent exports.

View
Use the View drop-down menu to choose between three viewing options:
- Card View – Displays items in a grid of cards.
- List View – (The default view) shows items in as a vertical list.
- Map View – Presents items on a map for location-based browsing.

Card View and List View let you scroll up and down by click-dragging an elevator bar located on the right. Map View navigation uses Esri map-style navigation controls.
![]()
Click an asset serial number or ID to open that asset’s Summary Overview page. Click your internet browser Back button to return to the previous page or click the Assets link in the upper left to return to the Assets home page.
![]()
The total number of assets is shown in the lower left, while the Results Per Page drop-down menu in the lower right lets you select the number of results to display.

Card View
This view presents assets in a grid and when applicable includes pictures to help identify the asset.

The example above shows meters in the Card View. Notice the Filters sidebar, which is open by default and can be toggled on and off with the Show Filters switch, includes toggles for viewing meters by their size, number of dials, and by Device Type (E-Series).
List View
List View displays details specific to the selected asset type in a searchable, paginated table.

-
- Click Fields on the the right side of the table to open the Fields menu.

- Depending on the type of asset displayed in the List View, different fields will be checked by default. To select/deselect additional fields, check or uncheck the appropriate boxes. In addition, selected/checked fields persist even after you navigate away from and return to the Assets page.
TIP: If you cannot see the entire list of available fields, hover your cursor over the list and scroll vertically. - Click the Fields tab again to collapse it.
- Hover your cursor over the table and scroll left to view the additional fields.
- Click-drag any field to reposition it in the list.
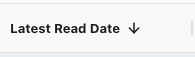
- Click to the right of any field name to reverse the sort order of the list. NOTE: The arrow (see below) will not be visible until after you click.
 Notice right-clicking also lets you add a Filter, add or modify a Label (see Label Assets below for details), add the asset to Favorites (see Favorites below for details), copy a value and copy a row of data and include the Column Headers.
- Click Fields on the the right side of the table to open the Fields menu.

Edit Gateway Settings
Gateways provide a secure means to transmit ORION Fixed Network endpoint data to AquaCUE.
To edit a Gateway:
- Select Gateway from the Assets drop-down menu.
- Find the Gateway of interest and click its serial number to jump to the Summary page for that gateway.

- If desired, click the down-facing arrow on the right (circled in red above) to expand the summary.
- Click Edit in the upper right corner of the screen and follow the procedure described here.

Label Assets
Labels let you add meaningful descriptions that enable enhanced searchability and easier categorization of assets. These descriptions let you organize and filter assets based on specific criteria, improving the efficiency of locating relevant assets within the system.
To Label the current asset:
- Find the Asset of interest and click its serial number or ID to jump to the Summary page for that Asset.
- Click the Edit Labels button.
 If the asset is already labeled, click the Edit Labels button to open the Labels menu.
 Type a meaningful Label in the box, press Enter, and click Save Changes. Click the X next to a label to remove that label.
Once labeled, you can filter assets based on their labels by making the Labels field visible in the List View.
TIP: From the List View, click-drag to select multiple assets and then right-click to add a single label to all selected assets or modify an existing label.


Navigation Tips
Move through the Assets page faster using these tips:
- In List View, click-drag columns to reposition them.
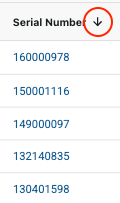
- Click a column name to toggle the sort order. An arrow (circled in red below) indicates whether the order is ascending or descending.

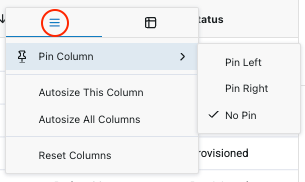
- Click a column name, and then click the icon (circled in red below) to Pin, Autosize and Reset columns.

- Use the bar at the bottom of the window to scroll left and right.
- When running Windows, the shift-scroll wheel on a mouse lets you scroll left and right.
- Click any column to sort the search results by values in that column.
NOTE: When an asset is linked to other assets, those links are displayed. Click the linked asset image to get more details about that particular asset.

In the example above, for example, the endpoint is linked to a register and an E-Series meter with an integrated valve.
Map View
Select Map View to display results on a map based on the latitude and longitude values passed to AquaCUE via Data Exchange files for endpoints and meters or entered manually on the Gateway setup screen. If an asset is not associated with latitude and longitude coordinates, the asset(s) will not be displayed on the map.
With All Assets selected, notice that assets appear grouped or clustered in circles.
- Click a cluster to display the assets included in the cluster in a drawer next to the map.
- Double-click a cluster to zoom in.


To get a single-asset view:
- Look for individual pins on the map and double-click the pin of interest.
- Search for that asset serial number or other identified such as Status, Hardware Version, Firmware version, GPS Location, and last communication date and time.
- Click Asset Details to get a Summary Overview of the selected asset. If designed, click the down-facing arrow on the right (circled in red below) to expand the summary.

TIP: When viewing the Summary Overview of a single asset, click the Favorite Star (circled in red below) to add the current asset to the Favorite Assets list.

The gray star will turn yellow to confirm that the asset is part of the Favorite Assets list.


Time Series Data
Click the Time Series tab in the upper right corner of the asset Summary Overview page to get a display of the time-series data associated with that asset.
Options
Use the Options drop-down menu to:
- Reset Column Preferences – If the order of the fields was previously modified, this function returns them to their default state.
- Access to Original Endpoints Page – Jump to the original Assets>Endpoints page.
- Access to Original Gateways Page – Jump to the original Assets>Gateways page.


Filters
The Filters sidebar is open by default. The Show Filters switch lets you toggle the Filters sidebar on or off.

Basic Filters let you quickly find what you are looking for by providing toggle switches that enable/disable filterable parameters. For each asset type the first two filterable parameter toggle switches are displayed by default. Click See more to display all of the available filters for a specific parameter. NOTE: Parameters differ by asset type.
Each toggle switch enables and disables the corresponding parameter.
In addition, the Filters sidebar lets you:
- Search for specific filters by typing in the Filter Search box.
- Save the current settings.
- Create public and private Filter Sets for instant recall by you or your entire staff.
- Add Advanced Filters to apply logic to help you further refine search results.
- Reset filters.


TIP: To quickly find a parameter of interest, start typing its name. AquaCUE looks ahead to find matching fields. So, for example, type Sta to quickly find the Status field. If you only type part of the word you are searching, you may not see it until you click See more.


In the example on the left above, a user typed “prov” in the Search box, returning the Preprovisioned Status toggle switch. In the example on the right, the user clicked See more to reveal all matching results for “prov,” e.g. the Preprovisioned and Provisioned Status toggle switches.
Advanced Filters
Advanced Filters let you define and apply logic to your searches. This helps refine search results and speeds the search process.
To add logic to your searches, do the following:
-
- Click + Add Advanced Filter.

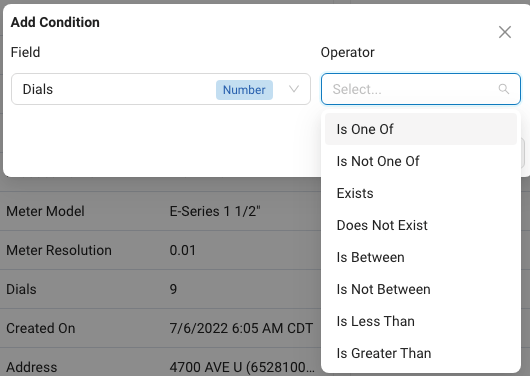
- In the Add Condition menu, use the Field drop-down menu to select a field of interest. The list of available fields differs based on the asset type being viewed. When applicable, use the scroll bar to see more fields.

- Use the Operator drop-down menu to apply logic to the field you selected in Step 2.

- Use the Values drop-down menu to select from the available values.

Notice that the available operators are based on the selected field. In the example below, the list of operators for the Created On field is different from the Dials field operators list shown above.

- When appropriate, enter Start and End dates and times by typing or selecting from the Calendar and Time selectors.

- Use the up and down arrows to adjust the time setting.

NOTE: Prior to activation – while an endpoint is in the Available state – some fields pertaining to endpoints will be blank. This is because certain information, for example, Cellular Carrier, comes directly from the endpoint, which must be activate and communicating with AquaCUE to supply this information.
- Click + Add Advanced Filter.


Save Filter Sets
A Filter Set is a collection of advanced logic settings that can be recalled at the click of a button. Filter Sets can be private (only the user who created the filter can see it) or public (everyone in the utility can see it). When active, advanced filters are displayed under the Search box in the Filter sidebar. The total active count of applied advanced filters along with the enabled quick toggle filters is displayed in a blue circle next to the Show Filters toggle switch.

To save a Filter Set, do the following:
-
-
- After defining a filter by following the steps above, click Save in the lower right corner of the page (outlined in blue below).

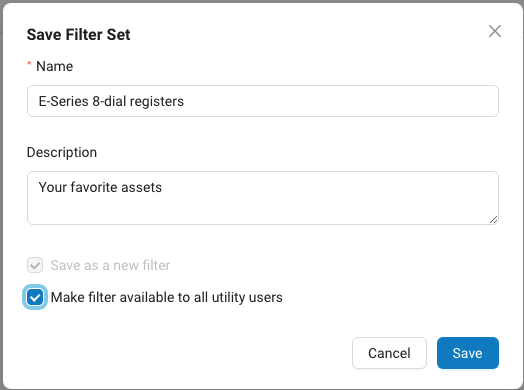
The Save Filter Set dialog box opens.

- Name the filter by typing a name in the Name box. This step is required.
- Enter a Description.
- If desired check Make filter available to all utility users (by default, Asset page filters are private).
- Click Save.
- After defining a filter by following the steps above, click Save in the lower right corner of the page (outlined in blue below).
-

To access saved Filter Sets, do the following:
- Click Open.
A drawer will pull out from the right side of the page. - Click the name of the Filter Set of interest to open it.Notice the Filter Set status is displayed
Favorite Assets
The Favorite Assets filter lets you bookmark frequently accessed assets for quick recall. This feature streamlines navigation, enabling users to instantly access and monitor Favorite Assets without having to search for them each time.
To add an asset to the Favorite Assets filter, do one of the following:
- In the List View, right-click an asset and click Add to Favorites.
- With a single asset selected, click its serial number to open its Summary Overview, and click the gray Star (circled in red below).

- Notice the Star turns yellow to confirm that its been added to the Favorite Assets list.


Admin users and users with permission to Take Ownership of pubic filter sets can click on the three vertical dot icon to take ownership of a Public filter set.

In addition, the owner of any given filter can edit the filter, delete the filter, make it public or private, copy the filter, and copy a shareable link to that filter.
When taking ownership, a dialog opens. Click Continue to modify the selected filter set. When finished save your changes or click Cancel to exit.
When viewing a filter, click the x next to the filter name under the Filter Search box (circled in red below) to close it.

Sensor Station
These assets let you monitor water quality.
To set up and create a Water Quality Sensor Station, do the following:
- Click Create in the upper right portion of the screen.
- Use the drop-down menu and choose Sensor as the Sensor Type.

- Complete the Sensor Station Information form.
 After completing sections 1-4 of the form, Step 5 will appear. If desired, use the toggle to configure the FTP site where sensor data will be transferred.
 - When finished, click Create, or click Cancel to exit.

- If you created a username and password in the FTP Configuration section, save those credentials in a secure location.

- Repeat steps 1-5 as needed to add additional Water Quality Sensor Stations to your assets.


Use the Sensor Overlays drop-down menu to toggle sensor overlays on and off. The < > arrows let you move an overlay to the left or right side of the chart, while the up and down arrows let you adjust the minimum/maximum scale on the chart Y-axis.

The timeframe selector arrows move the display backwards and forwards in increments.

Clicking anywhere in the center box the timeframe selector opens a menu that lets you select a different time increment.

5. Click the Summary tab to view mini-graph displays of consumption and related sensors if applicable for the selected endpoint. In this example, endpoint temperature and flow data are displayed.

Hover your cursor over any line or bar on a graph to see information for the selected point in time. Below left shows details on an Endpoint Temperature graph. Below right shows flow details on a Consumption graph.


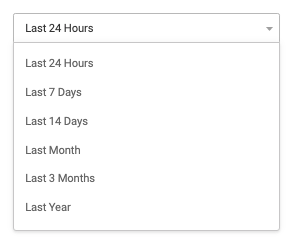
Use the drop-down menu on the right to select a display timeframe.
To go back, click Assets in the upper left corner of the screen.
![]()


