Use these links to jump to step-by-step instructions on how to:
Export Reads, Billing Reads, Consumption Data, Exception History and Diurnal Demand reports.
View a Consumption Graph
Print and Download Charts
Set or Edit a Flow Alert
Mark Favorites
Create Field Assignments
Schedule Valve Movements
Export Reads, Billing Reads, Consumption Data, Exception History and Diurnal Demand reports
Get Reads, Billing Reads, Consumption for networked meters, Consumption across a Data Range, the Exception History and Diurnal Demand data for up to 150,000 meters per export. If more than 150,000 meters are selected, only data for the first 150,000 meters will be exported. An export can have up to 1,048,576 rows of data. When exporting Reads, Billing Reads and Consumption using the Monitor>Actions drop-down menu, use any combination of filters to select meters to include in a Data Export.
Once you export a file from the Monitor>Actions drop-down menu, the file remains available for download in the Export Data panel until a new export file is generated.
See Browser Downloads for more on downloading files on your computer.
- Exporting Latest Reads creates CSV-format spreadsheet files that include meter reads, flow, account, location, service point, meter and endpoint data along with potential leak and backflow information.
- Exporting Billing Reads creates CSV-format spreadsheet files that comply with the AquaCUE Billing Read Export Specification and can be used with billing systems.
- Exporting Consumption (Networked Meters) data creates CSV-format spreadsheet files that include the day of the week, time flow was measured, total amount of flow, the flow unit of measure, and the number of meters with positive flow in each period. Consumption exports aggregate flow data so you can quickly see how much water is being used by a given set of registers over a selected range of dates. Includes networked meters only and excludes no flow and backflow intervals.
- Date Range exports create CSV-format spreadsheet files that include AMI and AMR meter reads, flow, account, location, service point, meter and endpoint data along with potential leak and backflow information for a selected range of dates. Previously, Consumption (Date Range) was called Date Range.
- Exception History Date Range exports CSV-format spreadsheet files that list the alerts from meters, encoders and endpoints along with the alert start and end dates. In the case of leak alerts for networked meters, the messages from these devices may differ slightly in timing from the AquaCUE leak alerts calculated based on flow occurring during each interval for 24 hours. Additional fields provide location, meter, endpoint, account and billing information.
- Use Diurnal Demand exports to identify daily peak water demand cycles. The CSV-format spreadsheet includes a field that displays the flow time along with columns that display one of:
- Meter ID.
- Meter Serial Number.
- Account ID.
- Endpoint Serial Number.
To export data, do the following:
- Click the Monitor tab.
- If desired, use filters to select meters of interest.
- Select Export Data from the Actions drop-down menu.

- In the Export Data menu, do one of the following:
• Select Latest Reads, click Start Data Export and save the resulting CSV-format file.
• Select Billing Reads and proceed to steps 10-11.
• Select Consumption (Networked Meters) and proceed to steps 5-9.
• Select Date Range and proceed to steps 5-9.
• Select Exception History Date Range and proceed to steps 5, 6, (skip step 7), 8, and 9.
• Select Diurnal Demand and proceed to steps 5-7, use the drop-down menu to select a Column Header as an identifier, and then perform steps 8 and 9.

NOTE: The top row of the Diurnal Demand export displays Flow Time and each Meter or Endpoint Serial Number, Account ID or Meter ID.

NOTE: The date and time shown in the Previous Export Results portion of the Export Data popup menu indicate when the previous export was performed.
Click Previous Exports to get a list of the last five exports performed locally on your computer. To retrieve any of the export files, click the corresponding Download link on the right side of the screen.

If you selected an export type that supports a Date Range:
- In the Export Options section, click anywhere in the Start Date field and use the Calendar to pick a start date.

- Click anywhere in the End Date field and use the Calendar to pick an end date.
- If desired, use the Read Interval and Unit drop-down menus to set read interval and unit of measure.
- Click Start Data Export.
- When the Export process is complete, download and save the resulting file. The file is in CSV (comma-separated values) format and can be opened in a spreadsheet program such as Microsoft® Excel®.If you selected Billing Reads:
- Click anywhere in the Billing Read Date field and use the Calendar to pick a date.


TIP: For best results, use the default setting of 72 hours.
Export Options
The Fieldsets drop-down menu let you select default and custom fieldsets that are public (available to anyone who can perform exports within your facility) and private (available only to the person who created the fieldset).

Show Advanced Options
Clicking Show Advanced Options lets you use the Quoting drop-down menu to include or exclude quotes around cells in the file being exported.

• Choose All to include quotes.
• Choose Minimal to quote cells that contain an extra delimiter (Account_Full_Name: “jane,smith”) and Meter Size Unit symbols (Meter_Size_Description: “1””).
• Choose None to exclude quotes.
TIP: For consistent read times:
• In a network environment where data is transmitted throughout the day, pick a Date prior to “Today.”
• For Mobile and Manual reads, pick the completion date of when the route was read.
• If you synchronized your billing system with AquaCUE using a Data Exchange file, and you changed the resolution of any of your meters before you export billing reads verify that your resolution changes have taken effect.
When to Include Quotes
When working with CSV files in spreadsheet programs such as Microsoft Excel® and Google Sheets, it is often desirable to put quotes around the data in each cell in the file. Putting quotes around the data forces the spreadsheet program to preserve the information between the quotes.
For example, without quotes, the spreadsheet program might drop the leading zeros from a number like 0001234 and display it as 1234. With quotes, the spreadsheet program will display the leading zeroes, so “0001234” displays as 0001234. The quotes themselves will not be visible because the spreadsheet program knows to hide them.
Note: Even when quoted, spreadsheet programs will drop trailing zeros from numbers. For example, 1234.75000 is displayed as 1234.75.
When commas separate the first and last name in the Account_Full_Name column, quotes tell the spreadsheet program to treat the comma as it would any other character, not as a delimiter. In a comma-delimited file, putting a comma between a last and first name would normally create an extraneous column and disrupt the integrity of the data in your file by shifting all of the data over by a column, so that it does not align properly. In the table below, row 2 shows what could happen. Row 4 shows how using quotes mitigrates the issue.
| Adjacent Column Headers | Account_Full_Name | Billling_Address_Line1 | Billing_City | |
| What you enter | Smith,John | 1234 Main St | Milwaukee | |
| What gets displayed | Smith | John | 1234 Main St | |
| What you enter | “Smith,John” | 1234 Main Street | Milwaukee | |
| What gets displayed | Smith, John | 1234 Main Street | Milwaukee | |
When to Exclude Quotes
If your billing system does not automatically ignore quotes, choose None. With None selected, AquaCUE still knows to “escape” full names that are separated by commas by automatically inserting a backslash into the appropriate cell. For example, when escaped Smith, John becomes Smith\,John. This preserves the alignment of the data in your files.
View a Consumption Graph or Get a Map for a Single Location/Meter
- From the At a Glance, Monitor, Assets or Users page, enter one of the following in the Search box:
• Account Name
• Location ID
• Location Name
• Meter ID
• Meter S/N
• Service Address
Press Return.
- Alternatively, from the Monitor page locate the Card of interest, click More and choose Hide Other Meters.
- Click the Graph button to display a Consumptions Graph.
Click the Global button to get a map of the location.
Print a Usage Graph
- Click the Monitor tab
- Locate the desired account:
• Use the filters on the left side of the screen.
• Enter the Account ID, Account Name or Meter ID into the Search box.
• Scroll through the endpoints list to find the Card.
Click the Print or Download button and select the desired action:
- Print Chart – A print preview windows opens so you can set the print details.
- Download PNG image – The image can be saved, printed or attached to an email.
- Download PDF document – The document can be saved, printed or attached to an email.


Set or Edit a Flow and Leak Alert
Setting or editing flow and leak alerts that apply to the current meter. Changes made to an alert by an EyeOnWater user or by the facility will override previous alert settings.
-
-
- Click the Monitor tab.
- Locate the desired meter card:
- Use the filters on the left side of the screen
- Enter one of the following in the search field: Account Name, Endpoint S/N,
Location ID, Location Name, Meter ID, or Service Address into the
search field - Scroll through the endpoints list to find the card.
- Click the Set Alert button on the meter card to create a new alert, or click the Edit Alert button on the meter card to revise an existing alert and then do the following:

-

-
-
- In the Alert configuration menu, select either Continuous Flow or Intermittent Flow and click the next arrow.

- If Continuous Flow was selected, enter a number of gallons per hour to set a Maximum and a Minimum flow threshold and click the next arrow.

If Intermittent Flow was selected, set a Maximum flow threshold and click the next arrow.

- Type the email address of the individual to get the alert notifications into the Add Email box and click the plus sign. Repeat this step as many times as needed to add all the desired email addresses.

- In the Alert configuration menu, select either Continuous Flow or Intermittent Flow and click the next arrow.
-


NOTE: To send the alert as an SMS text to a phone the phone number must be entered as an email address. For example: 5558675309@txt.att.net
-
- Set the interval for the reminder message (Day, 2 Days or 3 Days) and click the next arrow. Note: The default interval is Day. If an interval of Week or Month was set previously, it automatically updates to 3 Days.
- Verify that the alert is set correctly in the preview.
- Select the desired notification using the Start (send a notice at the start of a leak), Reminder (warns of an existing leak) and Stop (alerts you when a leak stops) tabs.

- When satisfied, click the Save button.
For 3″ and 4″ E-Series Ultrasonic meters connected with ORION Cellular LTE or LTE-M endpoints with sensors, click the Alerts button and then do the following to create a new alert or revise an existing alert:

Click any Alert type to toggle it on or off and open one of the following Alert configuration menus.
-
- Low/High Flow Alert

- Low/High Flow Alert

TIP: To set a Leak alert, enter a high flow alert threshold in Above __ Gallons/hour and leave the low flow alert threshold value blank in Below __ Gallons/hour.
- Water Pressure Alert

- Average Water Temperature Alert


To configure the any of these alerts:
- Enable the alert by clicking the slider
- Enter flow alert thresholds.
- Click Add New and enter an email address.
- Click the plus (+) symbol to commit the entry.
- Repeat steps 2 and 3 as often as desired.Note: Email addresses must be entered for each alert.
- Click one of Day, 2 Days, 3 Days to set the Reminder Frequency.
- Activate the Alert by clicking Save.
Monitoring Continuous Flow (Leaks)
While the system lets you and your customers that are using EyeOnWater set leak alerts per meter, we recommend that utilities regularly monitor continuous flow to identify potential leaks* by doing one of the following:
* AquaCUE detects continuous flow, which may or may not represent an actual leak. We highly recommend investigating continuous flows at locations where flow is expected to be intermittent, because it represents a potential leak.
- From the AAG page Flow Health module, click the Leak Detected arrow to jump to the Monitor page. The cards for all meters with potential leaks will be displayed ordered from highest to lowest total leak volume.

- From the Monitor page, set the Sort By menu to Leak Rate. Cards with potential leaks are displayed from highest to lowest total leak volume followed by cards for the rest of the meters in your portfolio.

To see the start dates for one or more leaks, do one of the following:
- From the AAG page Flow Health module, click the Leak Detected arrow to jump to the Monitor page. The cards for all meters with potential leaks are displayed in order from highest to lowest total leak volume.
- From the Monitor page, use the Actions drop-down menu to Export Data>Latest Reads.
- Open the file in a CSV editor such as Sublime Text (Windows and Mac OS) or NotePad++ (Windows), or import it into Excel using the procedure described here.The Start Date of each potential leak along with its volume are shown in the columns named Current Leak Start Date and Current Leak Rate (gal/hr), respectively.

Sublime Text view.

Excel view.
Mark Favorites
-
- Click the Monitor tab.
- Locate the desired account:
• Use the filters on the left side of the screen
• Enter the Account ID, Account Name or Meter ID into the Search box
• Scroll through the endpoints list to find the Card - Click the star in the upper left hand corner of the Card. Notice the account associated with the Card appears in the Favorites module on the At a Glance page.


Create Field Assignments
Utilities with ORION Mobile Read and ORION Field Application for Trimble Ranger handheld reading devices can collect the current reads, extended status and firmware version data from two-way ORION ME and ORION SE endpoints.

- Select meters to be assigned for reading by doing one of the following on the Monitor page:
- Select Location>Cycle and choose a Cycle.
- Select Location>Location Name and choose a location.
- Select Location>Route and choose a Route.
- Select Location>Zip and choose a ZIP code.
- You can also use any of the filters on the Monitor page to select one or more meters.

- Use Actions>Create Field Assignments to open the Create Field Assignments menu.
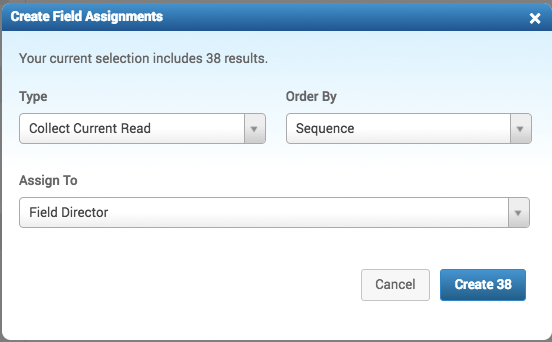
- Use the Type drop-down menu to select one of three job types:
- Collect Current Read – tells the reader to extract the latest read from the endpoint or meter.
- Collect Extended Status – tells the reader to extract Extended Status messages from the selected endpoint(s). Extended Status messages include Endpoint Tamper, Encoder Communication Error, Encoder Removed, Endpoint Low Battery, Endpoint Programmed, Endpoint Magnetic Tamper, Meter Exceeding Max Flow and Meter/Endpoint Programmed.
- Collect Firmware Version – tells the reader to extract the current firmware version of the selected endpoint(s).Note: When using ORION Mobile Read, send each assignment type separately. When using ORION Field Application for Trimble Ranger handheld reading devices, assignments to Collect Current Read are sent to the reader together with Collect Extended Status and Collect Firmware assignments.
- Use the Order By drop-down menu to select the desired read order.

- Sequence–tells the reader to use a read sequence to determine the order to collect reads in.
- Location–tells the reader to gather reads by location.
- Use the Assign To drop-down to assign the job to a user or leave blank to assign the job in Field Director later (requires the AquaCUE Field Application Suite).Note: If a user in the drop-down menu is paired with a handheld device (using the Assets>Handheld tab), assignments will be sent directly to the handheld device. In addition, the user has to be work-order-enabled by Badger Meter personnel OR paired with a handheld device to be listed in the drop-down menu.Click the Field Director tab and login to manage and monitor meter reading assignments.
- Click Create to make the assignment. (The number of meters in the assignment is listed in the Create button.)
Click Cancel to stop.


Schedule a Valve Position Change
-
- From the Monitor page, locate the desired account:
• Use the filters on the left side of the screen.
• Enter the Account ID, Account Name or Meter ID into the Search box
• Scroll through the endpoints list to find the Card - Click the Valve button on the Card to open the Schedule Valve Actuation popup menu.
 In the Schedule Valve Actuation popup menu, select the desired new valve position by clicking an icon.

Schedule Actuation On Next Communication is toggled on by default.
Click Specific Date and use the Date picker to schedule the actuation date. This lets you, for example, give a customer a deadline for paying their bill along with the ability to open their valve shortly thereafter.
- From the Monitor page, locate the desired account:

-
-
- Use the Select a Restricted Flow Reason drop-down menu to indicate why the valve is being used.

- Click Next to see a confirmation of the schedule actuation movement time.

- Click Confirm to accept, Back to start over, select a different reason for the restriction or to cancel the position change.
The alert bar on the Monitor page card shows the scheduled valve actuation message.
- Use the Select a Restricted Flow Reason drop-down menu to indicate why the valve is being used.
-


Cancel a Scheduled Valve Position Change
- From the Monitor page card for the valve that is scheduled to change position, click View Details in the alert bar.
- In the Schedule Valve Position popup menu, click Cancel Position Change to cancel the position change and remove the message from the alert bar on the card.
After Activation
- AquaCUE updates approximately two (2) minutes after scheduled actuation is complete.
- For five (5) calendar days after a valve closes, endpoint communication accelerates to once every two (2) hours. When the valve is opened, the call-in schedule reverts back to normal.
- Upon receiving a valve command from AquaCUE, the endpoint waits until it detects a 15-minute interval read with no flow, and then issues the valve command. The endpoint will try to detect a 15-minute interval read with a zero flow condition. If that hour expires due to constant flow, then the endpoint sends the command to the valve regardless of the non-zero flow state.
- The daily endpoint check-in time changes after a scheduled valve actuation. Select the Endpoint tab on an expanded meter card to see the Next Comm. (next endpoint communication) time.Important: For newly opened values, check the alert bar on the meter card for any Post Open Flow Action alerts that might indicate an unexpected flow condition.
Batch Valve Actuation
To actuate up to 500 valves at a time, do the following:
- Use an existing Monitor page filter or create a Saved Filter to select a group of valves to actuate.
TIP: The AquaCUE Esri map integration feature (additional fees may apply), lets you define two-dimensional spatial query areas based on polygons, squares or circles. Spatial query areas select any meters that they encompass. These areas can be saved as filters using the Saved Filter feature for later recall. If an area encompasses more than 500 meters, use other filters to further refine and reduce the number of meters selected to 500 or less. Any number of 500-meter sets can be sent for a single endpoint communication. Use the Has Valve filter to limit your Saved Filter to meters with valves.
- Use the Monitor>Actions drop-down menu and select Actuate Valves to open the Schedule Batch Valve Activation popup menu.


From this menu, you can:
- Filter results based on the valves that can be moved in the selected position.
- Schedule position changes.
- Cancel scheduled batch valve actuations.
Filter and Display Valves
To filter valves that are eligible to move into a given position, click one of the icons.
![]()
Notice the number of valves that will be actuated in the selected position is displayed in the lower left corner of the menu. In the picture below, 11 valves will move to the Partial position.

Schedule Batch Actuation
When scheduling or canceling batch actuation, remember the following:
- You can filter more than one current valve position on the Monitor page. Once in the Schedule Batch Valve Actuation popup menu, you must select valves that are eligible to move to a given position. For example, valves in the Partial and Restricted positions can both be scheduled to move to the Open position.
- If you schedule actuation for a specific date, the actuation date applies to all valves in the batch and each valve in the batch will actuate at its own unique next endpoint communication time on the specific date.
- If you schedule actuation for the Next Communication, each valve in the batch will actuate at its own unique next endpoint communication time.
- Click Next.
- Select the desired new position and schedule the actuation by selecting On Next Communication or on a specific date and time after the next communication.
- Click Next to see the confirmation of the selected valve position change and the scheduled actuation date/time. If you select On Next Communication, you will see the number of valves that will actuate on the next communication.

If you select Specific Date, you will see the scheduled date of the actuation.

- Click Confirm to accept the scheduled position changes. On the Monitor page card for the affected meters, the valve actuation message is displayed in the alert bar.
NOTE: For emergency purposes, valves tagged as Critical Needs Customer/No Valve Control can be included/excluded from the actuation at this step in the process.


Cancel Batch Actuation
To cancel a scheduled actuation, do the following:
- Use an existing Monitor page filter or create a Saved Filter to select a group of valves whose actuation you want to cancel.
- From the Actions Actions drop-down menu on the Monitor page, select Actuate Valves to open the Schedule Batch Valve Actuation menu.

- Click Cancel, then click Next.
- Click Confirm to accept the cancellation. Actuation is canceled immediately and the message is removed from the alert bars for the affected meter(s).


