The Dashboards page lets you visualize event time series data. This lets you use customizable modules to quickly:
- Chart data.
- Track trends.
- View meters and endpoints with exceptions that occurred during a specified time range or view the affected devices on a map.
- Aggregate data from multiple data sets.
- View and create collections of modules and save them as dashboards.
___________________________________________________________________________
About Events
Events are user-definable conditions that when met become active events. When the conditions are no longer met, the event has ended.
Events apply to network meters.
___________________________________________________________________________
To get started:
- Use the drop-down menu in the upper left to select one of:
All – displays all available dashboards.
- To view a Dashboard, click its name in the Dashboard Name field.

The Continuous Flow Dashboard (above) is a collection of two modules: a Continuous Flow Map and Continuous Flow Trends per day.
Each module includes:
- Timeframe selector pull-down menu – displays both active and ended events within the selected timeframe. The timeframe defaults to Last 72 hours.
And one of:
- Top Results pull-down menu available in Chart-type modules – aggregates active and ended events by the Group By/x-axis parameter. For example, if the x-axis is Service_Point_Route, Top Results will display results by Service_Point_Routes with the largest number of events to the smallest number of events by Service_Point_Route.
- Buttons to:
- Export Events – Opens a drawer that displays an overview of the data being visualized, the available fields (toggle fields on and off by checking/unchecking field names), and see
- Edit the module (requires role-based permission).
- Delete the module (requires role-based permission).

- Info icon – opens a dialog that displays module details. Shown below are details for Continuous Flow Trend module. Click the blue View Events link to jump to the Explore page where you can get details about each event in the selected timeframe.

Click the blue View Events link to jump to the Explore page where you can get details about each event in the selected timeframe.
Tip: The total number of unique events is displayed in the lower right corner of each module.
To create a module, do one of the following:
- Click Create Dashboard in the upper right corner of the page, select New dashboard, and proceed to step 2.
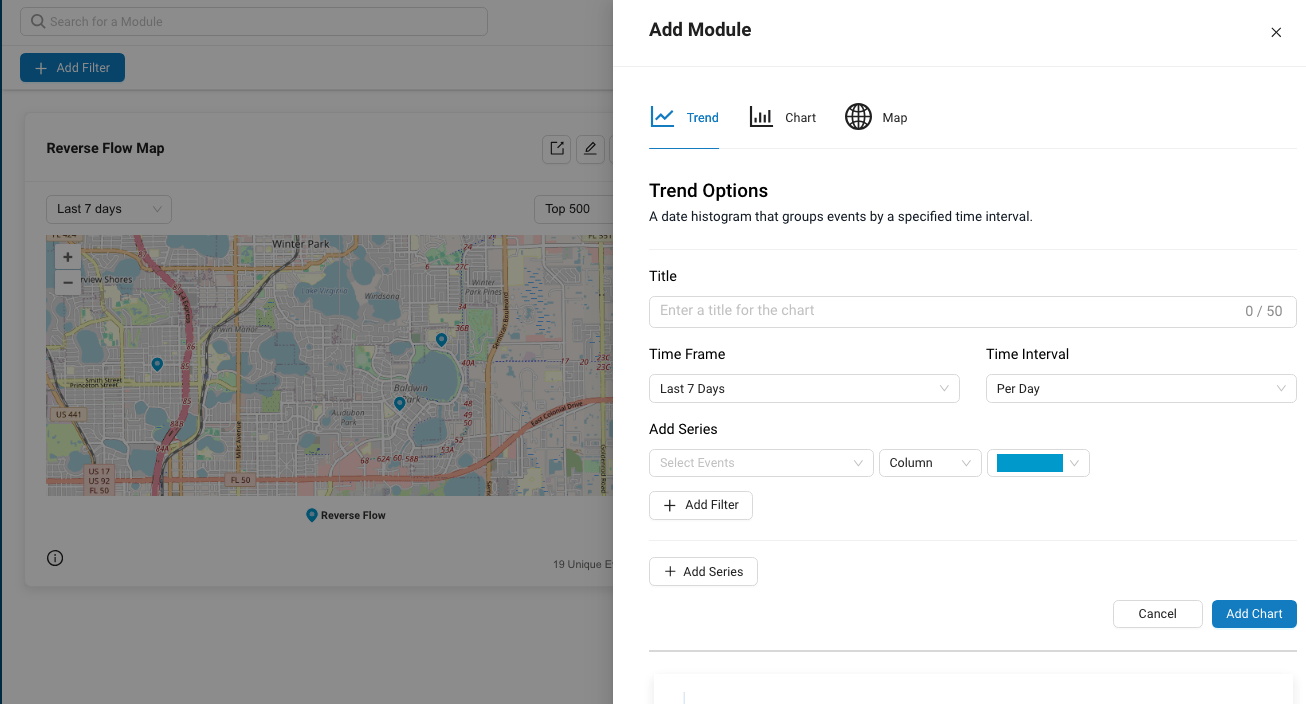
- Click +Add Module to open the Add Module drawer.

- Select one of:
Trend – Create a module that groups events by a specified timeframe.
Chart – Create a module of No Recent Communication events or a specified event (user-defined conditions).
Map – Create a map and display specific events that occurred during the selected timeframe. - Type in the Title field to name your module. Titles can be up to 50 characters in length. The current character count is displayed on the right side of the title box. The green circle turns red when the character count exceeds 50.

- Use the Time Frame drop-down menu to select a timeframe.

- Use the Time Interval drop-down menu to select a time interval.

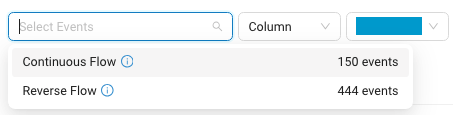
- Use the Add Series drop-down menus to select events.

- Use the Column drop-down menu to select one of:
Plotting Option Example Area  <
<Column 
Bar 
Line 
Scatter 
Spline 
- Use the last drop-down menu on the right to select the color of the selected event on the graph.

TIP: Change the color of each time series to differentiate events.
- If desired, click + Add Series and repeat steps 7 – 9 to add additional time series events to the module.In the example below, blue bars show Continuous Flow events, red bars indicate Reverse Flow on Jan. 24) and green bars show events in which flow exceeded 53 gallons for 24 hours.

11. When finished, click Add Chart to add the module to the currently active dashboard.
Create New Dashboards
Collections of modules can be saved and viewed as dashboards.Dashboards can be public (viewable by any staff user in your facility) or private (viewable only by the person who created the dashboard).To create a dashboard:
- Use the last drop-down menu on the right to select the color of the selected event on the graph.
- Click Create Dashboard.
- Give the dashboard a name by typing it into the Title field. Dashboard titles can be up to 30 characters in length. As you type, the current character count is displayed on the right. The green button will turn red when you reach the character limit.
- Describe the dashboard in the Description box. Descriptions can be up to 200 characters in length.
- Choose whether the new dashboard will be public or private by checking Make dashboard available to all facility users.

- When finished, click Save. Click Cancel if you do not want to proceed.
You can also click the three dots under Actions to do one of:
- Copy the corresponding dashboard. Use this function to jumpstart the creation of other, similar dashboards.
- Make Private/Public – NOTE: This function becomes available when you click Take Ownership. (Requires an Admin user role.)
- Edit Dashboard – Change dashboard parameters.
- Delete Dashboard – Remove the corresponding dashboard. This function cannot be undone.
- Copy link – Saves the URL of the corresponding dashboard to your computer clipboard so you can share the link with others. NOTE: Viewing the link requires AquaCUE user access.
- Take Ownership – Gives Admin users the ability to modify and delete dashboards created by other users.
Search results are paginated.

Click Previous and Next to step forward and backward through the pages.
Use the N / page drop-down menu in the lower left portion of the screen to select the number of results to display.

Public – dashboards visible to all facility users.
Private – dashboards visible only to you.
Sample dashboards let you quickly visualize conditions that typically require attention, namely, Continuous Flow and Reverse Flow.